
The short version
One August week, daily sales on owningafender.com — my content-turned-product guitar site — fell from about five a day to zero. No error fired anywhere: Lambdas ran clean, Stripe was healthy, the webhook recorded every completion. The cause turned out to be a cluster of small UI changes on the highest-converting surface of the site, found not by reading diffs but by watching which rate moved. The fix was a revert, not a redesign. And the incident budget mostly went into making sure the next one gets caught in hours, not days.
The cliff
The site’s funnel is: organic search → a free serial-number decoder → a paid offer ($9 valuation, $15–19 setup guides, a $5 history report). July 30 – August 3 was the best sales window the site had ever had. Then:
Aug 4: 1 sale Aug 5: 1 Aug 6: 0 Aug 7: 0 Aug 8: 1 Aug 9: 0The instinctive suspect list was long: a checkout change, the backend, a new auto-refund Lambda, product-page redesigns, a reviews cleanup. Every one of them was exonerated in turn — the Lambdas ran error-free all week, Stripe sessions and the purchases table agreed 1:1, the refund Lambda had never fired, and the reviews change shipped after the drop.
Insight 1: check the measuring stick first
The client-side purchase analytics event was double-counting. Success-page URLs carry the Stripe session id, and when buyers shared or revisited them, the beacon fired again — one real sale produced eight “purchases” in the events table. The “peak” I was mourning was partly phantom.
Ground truth had to come from the immutable sources: Stripe checkout sessions and the DynamoDB purchases table written by the webhook. They agreed exactly, and they showed the drop was real — just smaller than the events said. Real completions fell from ~2.2/day to ~0.3/day.
Insight 2: trust the rate, not the count
At single-digit daily sales, any day can be a zero — counts can’t tell a trend from a Tuesday. Rates can. I decomposed the funnel into rates per day:
| stage | Jul 26 – Aug 3 | Aug 5 – 9 | change |
|---|---|---|---|
| serial decodes (traffic) | ~292/day | ~281/day | flat |
| estimate CTA click-through | 3.09% | 1.78% | −42% |
| Stripe sessions created | 23.2/day | 10.2/day | −56% |
| completion per session | 9.6% | 3.2% | suggestive |
Traffic was untouched; half as many people started checkout. The click-through drop is the kind of number a one-sample z-test settles. If the true rate is the baseline p₀, then over n trials the count is binomial:
z is how many standard deviations the observed count sits from what the baseline rate would produce at that volume; |z| ≥ 1.64 means a dip that deep happens by chance under 5% of the time. The CTR collapse came out at z ≈ −3σ over ~1,400 decodes. Not variance. A change — and the change was on the decoder’s estimate surface, not in checkout.
To put that in everyday terms: if the baseline rate were truly holding, a dip this deep at that volume would appear by chance about once in every 700 windows — well past the 1-in-20 threshold where it’s cheaper to blame noise than to investigate. That’s the practical value of the z-test at low volume: it tells you when to stop second-guessing the dashboard and go find the deploy. All it takes is a few cells in a spreadsheet — your trial count n, the observed hits, and the baseline rate p₀ — and the z-score that falls out is enough to act on.
Two reverts, two answers
Four changes had landed on that surface in 36 hours: a “coming soon” cross-sell card injected under the buy button, an email-capture field above it, a “how it works” line between the button and the trust badges, and a demotion of the product CTA below the intro blocks on all 24 decoder pages. I reverted them in two waves and watched the rate after each:
- Wave 1 (the loud additions — cross-sell card, email field): next day, 1.71%. No recovery.
- Wave 2 (the quiet ones — the how-it-works line, the CTA demotion): the rate snapped back above baseline within hours, and the first purchase through the restored surface arrived seven hours later.
The changes nobody thought needed a review hurt the most. And the one with an explicit “[HOLD]” title in the PR probably shouldn’t have been on the page at all.


The product pages got the same treatment
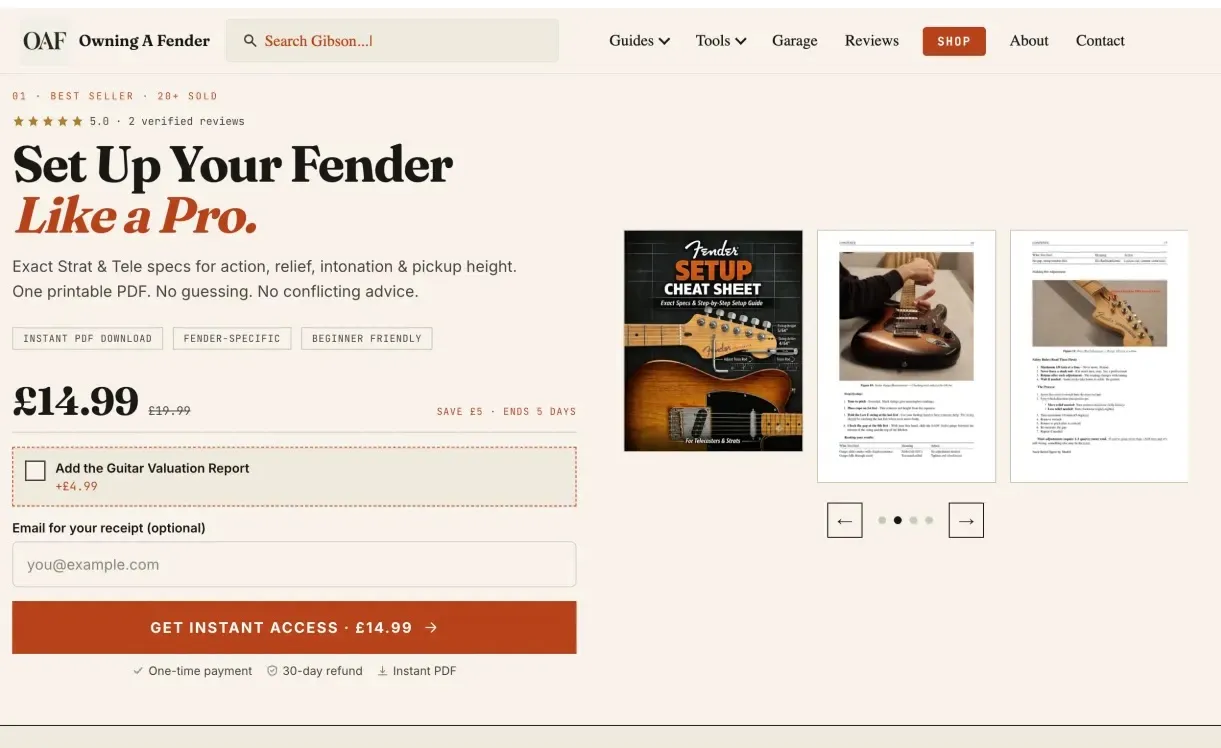
The same week, the product pages’ hero galleries were standardised back to the three-up thumbnail strip that was live during the best-converting weeks. I can’t prove the strip out-converts the featured carousel — at ~0.5 on-page clicks a day per product, no test can power that — so the decision was made on consistency and risk, and the measurement tooling below is what makes it a measurable question next time.

The guardrails that came out of it
The postmortem took days partly because nothing was watching the right numbers. That got fixed too:
- Conversion-surface guard — any PR that touches the decoder, checkout or product pages gets labelled and fails CI until a human posts a baseline-metric analysis. Hard to bypass silently, one click to bypass deliberately.
- Deploy markers — every production deploy posts an event; the analytics dashboard renders it as a tick on the funnel sparklines, so “what shipped near the dip” is a glance instead of a day of git archaeology.
- Regression badges + z-scores on every funnel step — the dashboard flags any step whose trailing two-day rate drops statistically below its own baseline.
- A purchase-drought alarm — a daily cron that pages me if sales flatline for two consecutive days while traffic is otherwise normal.
- Standing readouts —
yarn estimate-ctrandyarn product-ctranswer “did this deploy tank the rate?” with a z-score verdict, down to six-hour blocks around the deploy timestamp.
The lesson
At single-digit daily volume, every day looks like a trend. The count said panic; the rate said where to look. The z-test didn’t just find the cause — it stopped me reverting the wrong things.
If your own funnels only get watched after something breaks, this is the kind of measurement layer I build for clients — a dashboard that confirms a dip is real before it becomes a bad week, and a z-score answer to the question every deploy change deserves: did that actually move the rate? Start a project if that sounds like your deployment process.